Question: Do you need to calculate horticoltural lighting directly in PAR units?
Solution: With Pv+Lc Horti Plus this is possible
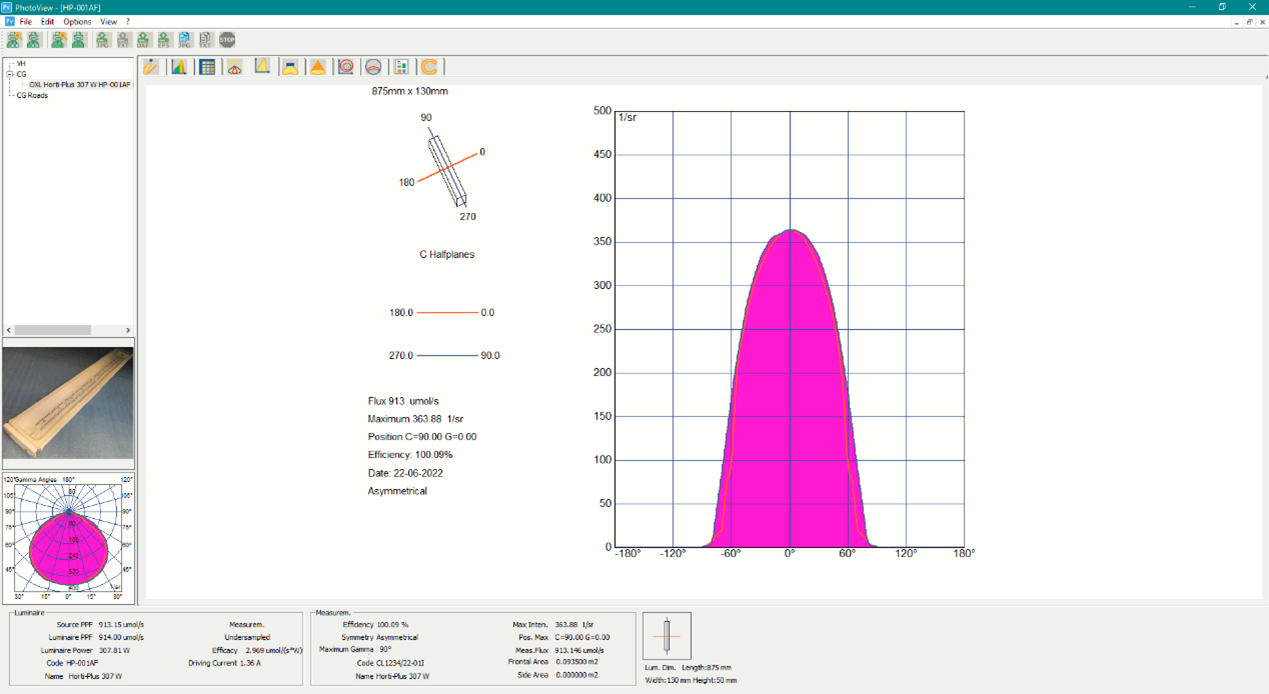
Photoview – Horti is the Photoview section for the management of photometric and spectrum data in the horticultural field (400-700 nm) of luminaires and light sources used for increasing and improving plant growth.
The photometric and spectrometric data can be converted into, displayed as and printed as industry-typical graphics and charts.
The graphs and tables managed by Photoview - Horti are:
• spectrum graphs for the horticultural field
• spectrum graph and color plane according to the 3 typical configurations (CIE 1931 – CIE 1960 and CIE 1976)
• spectrum graph and evaluation chart of the various PAR parameters
• graphs for the McAdam analysis
• polar and cartesian diagrams
• 3D photometry visualization
• beam spread diagram
• isolux and isocandela curves
• technical data sheet
• custom graphics
Photoview - Horti features an option to color the graphs according to the color coordinates of the measured integral spectrum
Sample Gallery:
Are you interested in further reading? Find more relevant use cases here:
|